
|
||||||||||||||||
|
|


|
||
|
|
|
|
|
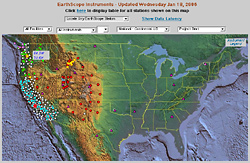
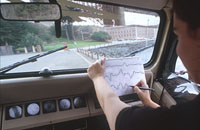
While such traditional seismometers are still in use, many researchers now employ more sophisticated digital data recorders. These modern seismometers are a great improvement over their predecessors: They can sense very tiny motions, and measure movement in all three dimensions at once. Digital seismometers are often connected to a computer network, so seismologists can get information about earth movements just after they happen. Many of these networks are accessible to the public, which means that you can find lots of current earthquake data on the Web . Modern seismometers also make it much easier for seismologists to share information. A paper seismograph has a lot of information to offer, but how can a scientist share it? Photocopies, or even photos, of the squiggles lose some of their information. Digital data from new seismometers are easily transferable. The most powerful advantage of digital seismometers is the ability to link any number of them together in an array. Computers can then collect and compare earthquake data from the seismic stations in the array as the waves move past them. This works because the waves sent out when the earth shifts travel out in all directions, and can go all the way around the planet. They decrease in strength as they move away from the location of the quake, but arrays and individual stations throughout the globe can detect them, tracing the waves as they pass through all parts of the earth. This kind of data collection gives seismologists a picture of the deeper regions of the earth—all the way to the core—because the waves move through different areas differently. There are many seismic arrays all over the world: in rural areas, cities, and even in uninhabited Antarctica. As part of a project called EarthScope, several government agencies are working together to blanket the entire United States with seismometers placed an average of 70 miles apart. From this array, they hope to not only be able to observe quakes in the United States, but also to clearly see the waves from quakes around the globe as their signals travel through North America.
From waves to Richter
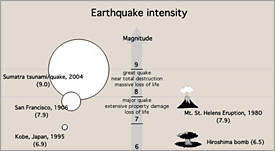
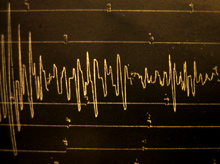
In both scales, a jump of one number is equal to a 10-fold increase in the size of the waves in a seismogram and a 30-fold increase in energy released. In other words, if a 3.0 magnitude quake leaves a squiggle an inch high on the seismogram, a 4.0 will leave a 10-inch squiggle and release 30 times the energy. It's easy to see how the amount of energy released goes up very quickly with an increase in magnitude. Magnitude, or the energy released in a quake, can tell us something about how big a patch of earth has ruptured. If only a few square miles of a fault are involved, the quake might be a five. If ten times more area ruptures, the magnitude will go up by one. Huge quakes can involve tens of thousands of square miles along the length and depth of a fault. The area of rupture responsible for the December 2004 tsunami was over 77,200 square miles (over 200,000 square km)— bigger than the entire state of South Dakota.
More than magnitude
|
||
|
|
||
Live Eye • Great Shakes • Quake Basics • Damage Control • Active Zone